Monday, August 15, 2016

Adjusting the September


 After having the September position on for a few weeks, I have had to make a few adjustments:

August 5th: I had to add two of the 1200/1220 verticals in order to reduce the negative Delta of the position. The market was sitting outside of the tent so I had to adjust the position to have less than -50 Delta.


August 8th: The position had too much negative Delta again so I had to add the 1200/1210 vertical in order to correct it. With the addition of this vertical, the positive Theta and the negative Vega both increased. On this date, the position was up $545.

August 12th: With the negative Delta reaching -55, I had to add the 1200/1220 vertical to the position. Adding this vertical reduced the negative Delta of the position from -54 to -40. The position is currently up $441.

The current risk profile graph looks like this:


Stay tuned over the next few weeks as a keep adjusting my September position!


Wednesday, August 3, 2016

Closing the August Position


  Over the past few days, I have made a series of adjustments to my August position. All of the adjustments I have made were as a result of too much negative Delta. On July 27, July 28, and August 1, I added the vertical 1170/1200 to reduce the negative Delta value of the position (they were at -61, -67, and -60 respectively). The market had been outside of the tent for all of these adjustments. I decided to take the position off yesterday, August 2 with a profit of $1,018. With only 16 days left until expiration, I thought that I should take the profit -which has not been over $1,000 for the position- while I could.

The final risk profile graph of the August 2016 position can be seen below:


The September position is currently at a $479 profit and no adjustments have been needed for this position over the past few days. The September position still has 44 days until expiration.

This is what the September position's current risk profile graph looks like:

Tuesday, July 26, 2016

September Position and Updates to August Position


      As I said before, I put on my September position on Friday, July 22 with 56 days until expiration. The butterflies were placed at 1180 with the lower and upper wings at 1130 and 1230 respectively. I then bought a call at 1040 but that was not enough to offset the negative Delta of the butterfly so I added the vertical 1180/1200. Adding the vertical made the total Delta of the position -6 which is close to the ideal -5 starting Delta value for the M3 position. No updates have been necessary to the September position since Friday and the position is currently down $441.

Here is a risk profile graph from Friday:


            Now for the August position. Today, July 26, I moved half of my butterflies up to 1180 because the Vega value of the position was almost positive (only -6) and the market was 10 points above the upper wing. I also had to add the vertical 1180/1200 to reduce the negative Delta of the position from -57 to -45 which also increased the positive Theta and negative Vega. Having all the verticals of the position at 1180/1200 helps reduce the commission cost if this were a live trade. The position is currently down $53 and I see myself taking it down in the coming week since there are only 24 days until expiration.

The current risk profile graph looks like this:


Thursday, July 21, 2016

Updates in the August Position


    With the market climbing significantly higher over the past week and a half, I have made a couple of adjustments to my August position. The first adjustment was on July 11 where the market had made a large move up and my Vega had become positive 80. In order to correct the value, I moved all of my butterflies up to 1160. The next adjustment was adding the verticals 1180/1200 in order to reduce the negative Delta of the position. Before the verticals were added, the value of the Delta was -72 which is -22 more than the allotted -50 Delta value outside the tent. This adjustment was made on July 12 and the Delta of the position is now -48.

This is what the risk profile graph looks after the first two adjustments:


A few days later, on July 15, I added two additional vertical spreads of 1180/1200 in order to reduce the negative Delta value of the position which was -72. With the addition of the verticals, the Delta value of the position became -42.

One July 18, I added two more of the verticals 1180/1200 for the same reason of reducing the negative value of the Delta value of the position. The value went from -57 to -42 and the value of the Vega became more negative as well.

The last adjustment of the week was on July 22 where I added two of the verticals 1180/1200 in order to reduce the negative value of the Delta from -68 to -26. The position is currently down $600.

Here is the current risk profile graph:


Keep reading as I put on my September position this Friday!


Friday, July 8, 2016

Starting the August Position


       Even though there are only 43 days until expiration, I want to put on an August position. With the market at 1150, I put my butterflies at 1120 with the wings at 1170 and 1070. The butterfly had -113 Delta so I had to buy the vertical 1120/1140 along with a call at 970 to offset it. The Delta value is now -7, the Theta value is 94, and the Vega is -361.

Here is the current risk profile graph of the position:


Tuesday, July 5, 2016

Closing the July Position

     
         As you may have heard Brexit occurred two weeks ago and had large effects on the market. For a few days following the announcement, all the markets tanked a few percent every day all over the world. Having a position on at that time was nerve-wracking even though it was only a dummy position. I have many updates to record from the past two weeks that I will share with you below:

June 24th: On this day, I had to move my butterflies down to 1100 from 1120 in order to cope with Brexit repercussions.

June 27th: With the market tanking today, I moved all of my butterflies down to 1060. Now the position is at approximately 30 points below the market and is down about $1,000.


June 28th: Today I added the verticals 1080/1100 as well as moved half of my butterflies to 1080 in order to correct the positive Vega and negative Delta of the position. With the move, the Delta became -30 and the Vega returned to a negative value.

June 29th: I had to move the rest of the 20 butterflies up to 1080 because the Delta value had reached 24 which is a higher value then is what is recommended for the M3 position. Also, the Vega had turned positive again which was corrected with the movement of the butterflies.


June 30th: With yet another move up, I had to move all 20 of the butterflies to 1120 (30 points below the market position of 1150). At this point, the market is closer to the call than it was to the butterflies (before I adjusted them) and the Theta of the position became negative while the Vega of the position became positive. I also had to add the five verticals 1100/1130 because the negative Delta value was too high.

July 1st: The market only moved up 4 points today so it allowed the position to gain a little bit of the positive Theta but since the Gamma was negative and significant, I had to add the verticals 1130/1150 to keep the negative Delta within limits.

July 5th: I finally took the position off today with only ten days until expiration. Even though throughout a majority of the trade I was at a loss, at the end I made a profit of $1,483. I decided to take the position off because the Delta was very high and adjusting it again might risk the profit.

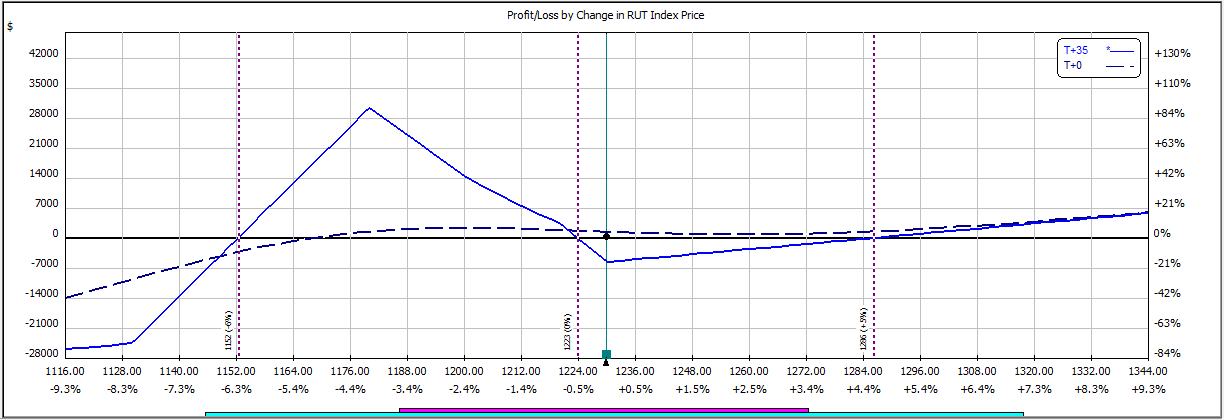
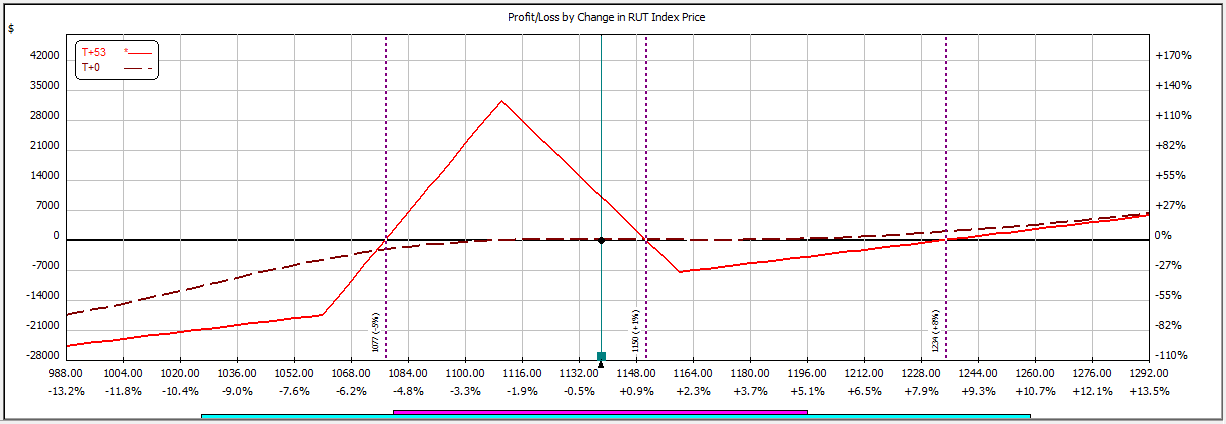
The final risk profile chart for this month can be seen below:


Thursday, June 16, 2016

Updating July Position

     This week has been pretty busy with exams but I finally got a chance to update my position today. Because of the recent drops in the market, I had to move my entire position down 20 points to 1120, 30 points below the market position of 1150 in order to have a lower Delta value. Before adjusting the position, the Delta value of the position was 40 which is double the allotted positive Delta rule. When I moved the butterflies back, there was still 31 positive Delta so I had to move the call up to 1020 and remove some of the positive Delta from that. The current position is down $200 and there are 29 days left until expiration.

Here is the risk profile graph of the current position:


The t + 0 line is a bit lower than I would have liked it to be but I'm sure in the following days it will rise as the Theta becomes greater.

Thursday, June 2, 2016

Updating July M3


        For the past few days, the market has constantly gone up so on Tuesday, I had to move my butterflies forward. As you may recall, I had put on 12 butterflies instead of 10 at the beginning of the position. With the adjustment forward, I took out the excess butterflies and the position now has the usual 10. I moved the butterflies from 1080 to 1130 with the market at about 1154. The Greek values from Tuesday are: Delta is -26.6, Theta is 102, and Vega is -489.

The risk profile graph can be seen below:

No other adjustments needed to be made to position after Tuesday. The current Greeks are: Delta is -44, Theta is 73, and Vega is -254. The position is currently down $100.

Saturday, May 21, 2016

Putting on an July Position


    Along with taking off my June position, I also put on my July position. I put it on Friday at exactly 56 day to expiration which is the recommended time. Because of the low Delta value, had to put on 12 butterflies at 1080 because only 10 butterflies would have had -85 Delta. With the 12 butterflies, the position had -99 Delta and to balance that I bought a 940 call with positive 95 Delta bringing the position's Delta to the recommended -5. The current Greeks of the position are: -5 Delta, -0.47 Gamma, 83.88 Theta, and -380.4 Vega.

The risk profile graph of the position can be seen below:


Closing the June Position


     First of all, I would like to apologize for not posting in a while. I was at the Virginia Junior Academy of Science a few days ago (unfortunately not with an options project like last year which you can see in my earlier posts) and did not have any wi-fi. I used Backtrader to follow the June position from last time I posted and on Thursday, May 12, I reached over $2000 in profit so I decided to take the position off. I did not need to adjust anything from the last time I posted so I was quite lucky this month. The position ended with the following Greeks:-12.4 Delta, -3.46 Gamma, 137.9 Theta, and -557.6 Vega. The exact profit for the month is $2171.

The risk profile graph can be seen below:


Thursday, May 5, 2016

Removing the May Position


     With the position being on for a few weeks, once I hit over a thousand dollars in profit on Tuesday I decided to take the position off. On Monday however, I had to adjust the position because it had accumulated -127 Delta with a sudden rise in the market. I added three verticals to the position to make the Delta -88 and since the market was inside the tent, the value was within the -100 limit. The position was closed with the Greek values of 21 for Delta (would have been a problem if I hadn't decided to take it off), 415 for Theta, -679 for Vega, and -8 for Gamma. The total profit of the position when taking it off was $1213.

The risk profile graph from Tuesday can be seen below:

Putting on and Updating my June Position


      Originally, I had planned to put on my June position at 56 days until expiration which is recommended for the position but I only just got around to it. I put the position on through BackTrader on Friday (49 DTE) which was down about nine points and at about 1130. Following the 20-30 points rule, I put on my butterflies at 1100 (being more worried about the backside than the front). I also bought a call at 1000 with a Delta of 90. When I put on the position, I also had to put on a vertical to balance the Delta since you shouldn't buy a call that is too far in the money (problems with extrinsic value).

The risk profile graph from Friday can be seen below:


       The position needed no adjusting until yesterday when the market moved back significantly and the Delta value became 18. Since the limit for positive Delta is 20, I found the value a bit too close for comfort and decided to move the butterflies down. It was not a significant shift, only 10 points, to adjust the butterflies to 1090. With this shift, the Delta was only 3 and was not as large of a concern. As of today, the position is up about $601 and the Greeks of the position are as follows: Delta 7.28, Theta 108, Gamma, -2, and Vega is -478 (bad for the position recently because the market has been down causing the volatility to rise but since the position has a negative value, it inflicts damage).

The current risk profile graph can be seen below:

Monday, April 25, 2016

Moving the Butterfly Forward (May Position)


        I apologize for not updating sooner but I have been busy with school. On Friday, I had to add verticals because the position Delta surpassed the allotted -50. I put the spread at 1120 and 1110 which brought the Delta back to within limits. Over the weekend, I had to move the remaining butterflies forward from the original 1070 position because the Vega became positive but the rest of the Greeks still fine, making it not possible to put in verticals. I moved the rest of the butterflies up to 1110 but doing so made the Delta -60 so I had to add verticals in order to bring it back to the limits. I added four verticals from 1120 and 1100. The Greeks are currently as follows: Delta value is -63 (this is fine because the market is under the tent and -100 is allowed in this area), Theta is 170 (notice this is starting to build up since there are only 25 days until expiration), and the Vega value is -370.

The current risk profile looks like this:


Wednesday, April 13, 2016

May Position Update


           After a few days of calm waters, the position finally encountered a storm. With the market up two percent today, the Vega became positive and I had no choice but the adjust the position. Because the Vega was only positive eight, instead of moving the whole 10 butterflies, I only pushed forward five. This is a technique I learned over the weekend while backtesting in a very volatile market. If the market continues to jump up and down constantly, it would be safer to move up part of the butterfly position and suffer minor losses instead of major ones. My original 10 butterflies were at 1070 and with the market currently at 1130, it was imperative that I adjusted. Currently, I have five butterflies at the original strike price and five butterflies at 1100. With just the moving of the butterflies, the t + 0 line began to sag in the area between the butterfly and the call so I had to add a vertical in as well. The vertical is located at 1110-1190 and helped bring the Vega even more negative (-229), the Theta slightly more positive (77), and the Delta a slightly more negative value (-34). The current position is at a loss of about $393 which was a big change from being up $350 just yesterday. Hopefully in the coming weeks, the market will settle and give a chance for the t + 0 line to build up in the back to increase the possible profit.

The current risk profile looks like this:


Monday, April 4, 2016

Closing of the April Position


      With the slight downwards move today, I have decided to take out my April position. This trade had many adjustments over the past few months and has been down many times. With only eleven days left for expiration, I was able to remove the position with a profit of $1,570. If this was the position at 30 days until expiration, I would have probably adjusted the position instead of cashing out but at this point in the trade, the Gamma started accumulating and even a slight shift of the market could throw the whole position off. The Greeks Theta and Vega are well in the limit (even flourishing if you will) but the Delta value currently is -170 and cannot be easily corrected by verticals. I look forward to continuing to post about the May position and the starting of the June position will be soon. The Greek's of the May position are well under the limit and no adjustments are needed at this time.

Below is the final risk profile graph of the April position:


                                        If you have questions or suggestions please comment!

Thursday, March 31, 2016

Adjustment of both April and May Positions


       After a huge rally this week, I was forced to adjust my April position on Tuesday, March 29, because of positive Vega and negative Theta values. Currently, the trade is only 17 days until expiration so I plan on taking it out within the next couple of trading days, most likely early next week after gaining the buildup of Theta over the weekend. In order to fix the negative and positive Theta and Vega values, I had to both move up my butterfly and add verticals. When I checked the position, it was at 106 Vega, too high a quantity to lower with verticals. I had to buy a new butterfly at 1070 since the market is at 1109 and sell my old butterfly. Once I did this, there was too much negative Delta (around -260) so I had to add 5 verticals at 1090-1050. The position after the adjustment has -67 Delta, 285 Theta. and -480 Vega values. Today, Thursday, I had to adjust the position again because of too much negative Delta outside of the tent. The limit is -50 outside and -100 inside but the position had -134 outside which is not good. I had to add 6 more verticals at the same 1090-1050 spread and in doing so was able to reduce the negative Delta values to -34. The current position is at $280 profit.

The risk profile of the April position can be seen below:


        Now on to the May position which needed to be adjusted on Wednesday. This position did not have values as extreme as the April position since I just put it on but the Vega went slightly positive on Wednesday which I needed to adjust. I added a single vertical at a 1090-1060 spread to make the Vega negative again. After adjustment, the Vega value is -16, the Delta value is 0 and the Theta value is 22. Today, I moved the butterfly up from 1050 to 1070 because the position had positive Vega again and the Delta value starting to become positive. The current position after all adjustments has -190 Vega, -14.4 Delta, and 49 Theta and is down $333.

The risk profile graph of the May position can be found below:


Monday, March 28, 2016

Putting on May Position

 
       Yesterday, I put on my May position at 57 days to expiration. The market was at 1079 from Thursday since the markets were closed on Friday. I put on my butterfly at 1050, about 30 points below the current market position. I was debating putting it at 1060 but I would not have the correct amount of negative Delta from that butterfly causing me to buy a closer to the money call, a position that would most likely have negative repercussions as the trade continues. The butterfly gave me about -90 of Delta which caused me to buy a call that was at 85 Delta at 990. The current position (not including the market movement of today) has a Delta value of -5.08, a Theta value of 53.96 and a Vega value of -260.9. 


        My April position still looks good. It is up about $200 currently which is not that significant because it is only 22 days until expiration. The minimal gain shows how volatile the market was over the span of the trade and how many times I had to adjust it, never giving the t + 0 line a chance to build up. I will keep posting as both trades continue!


Sunday, March 20, 2016

Adjustment of April Position


     Because of the market rising so consistently over the past few days, the position started to accumulate lots of negative Delta and the Vega value became positive. Currently, the position without any adjustment has -83 Delta, 115 Vega, and only 22 Theta. The market is outside of the tent so I had to add verticals since the negative Delta has surpassed the limit. I added four verticals to the position at 1080 and 1050 (the ones I bought at 1050 were the ones I had sold in the previous adjustment and doing this would be helpful in a real trade because it decreases execution costs) which helped to lower the negative Delta value (made it more positive) and decrease the Vega value. With the adjustments, the Delta value is -17.76, the Vega value is -11.69, and the Theta value is 58.04. The position is currently down $232 which is a big jump from the $1200 it was up only five days ago.

The current risk profile graph is pictured below:


Monday, March 14, 2016

Adding Verticals to April Position


           Today, I switched back to OptionVue to conduct my trades on. Surprisingly, as I went into the BackTrader mode and put in the position as I had before, I saw very different Greeks and would have likely not put on the same position (the Delta value was around -17 which is too much negative Delta to start off a position). Noting this, I continued to simulate the position as I had over the past two weeks and I adjusted the position again.

           I made this adjustment because the market is currently sitting outside of my tent but the position has an overall Delta value of -75. Because the limit for the position outside of the tent is -50, I had to add verticals. I sold three calls at 1050 and bought three at 1030 in order to make the overall Delta -49. I did not want to add too much positive Delta because the market could always reverse and if it does so, not only would the negative Vega value hurt the position but the Delta would start to also. Currently, the Theta value is 98.9, the Vega value is -170.9 (with the addition of the verticals) and the Gamma value is -0.64 (also something to watch, especially as the trade approaches expiration).


Of course the risk profile graphs are also going to be from OptionVue also.


Monday, March 7, 2016

Moving the Butterfly

         Over the weekend, because of the continuous bullish movement of the market, I had to adjust my position. The main reason was because my Vega value became positive, so in order to change it back to negative, I moved the butterfly from 1010 to 1040. The position I had to remove I took a loss. At the time, I was down about $950 but now the position is down about $1,367. While this may seem like a large loss after only a few days of implementing the position, I am not worried. The market has been bullish for the past two weeks and has risen 16% in only 16 days, a trend that is incredible. My position is ready for the market to retrace a percent or two but if it opens 3-4% down tomorrow, I may need to adjust the position again.

        Currently, the Greeks are all within their limits. The Delta value is -25.8, the Theta value is 48.8 (which will continue to build) and the Vega value is -55.7, all of which as suitable for the position.
Below is a picture of the current position and t + 0 line. I hope you all are enjoying this blog and don't forget to leave any questions or concerns in the comments.


Tuesday, March 1, 2016

Starting the Blog Again

         Hello Again! To start off, I want to apologize for being so quiet on the blog over the past few months. Over the next few weeks, I plan on restarting my updates continuing to put on live 'fake' trades. I will try to keep up to date while posting to the best of my ability but it is possible that I will miss an adjustment or two if I am busy. One thing to note is that I am now putting on my positions on the Think or Swim platform rather than OptionVue. This should not affect anything greatly but be ready for different colored charts.

       Yesterday, I put on a butterfly hedged with a call, just like I had been doing before. The butterfly was bought for the April expiration date which was 45 days but shouldn't be a major issue. I bought the butterfly at the 1010 strike price and my wings (remember they are 50 points wide) are located at 1060 and 960. The Delta of the butterfly came out to be about -76 so I bought a call with a Delta value of 70. Currently, even though the market is still fluctuating, the values of the Delta for the butterfly and the call are -90.12 and 80.56 respectively. The current position is down about $228, probably because of the 1.5% rally today right after I put on my position.

I am excited to continue doing this blog and am ready to continue expanding my knowledge of the options market!