Sunday, March 12, 2017

Weekly Update: Closing March and April M3's


These past two weeks have been exciting for the two positions I have currently been in. I have adjusted and closed both the March and April M3's, so you can find the details below.

March:

Wednesday, March 1: The Vega value of the position went positive after a massive, 26-point rally. To correct this value, I moved five butterflies up to 1370. I also had to add five 1420/1400 verticals to reduce the negative Delta that the moved butterflies had caused. With all of the adjustments for the day, the Greeks are: Delta value of -38, Theta value of 140, and Vega of -157.

The risk profile graph of the position after the adjustment can be seen below:


Friday, March 3: I decided to close the position at 14 DTE because the Gamma value was getting too high and I was profitable for one of the first times in the position. The closing Greeks were: Delta value of -69, Theta value of 293.5, and Vega of -452.7. I closed the position at a $1,396 profit.

The final risk profile graph of the March position can be seen below:


April:

Wednesday, March 8: The Russell 2000 was down eight points and the butterflies were only six points below the current market position. The Delta value of the position was too positive at 20.53, so I had to move seven butterflies up to 1390 in order to offset the Delta. The position now has a Delta value of 2.34, a Theta value of 112.1, and a Vega value of -656.7.

The risk profile graph of the position after the adjustment can be seen below:


Friday, March 10: The Russell 2000 was finally up a few points after being down all week. I decided to close my position for a $2,567 profit. The final Greeks were: Delta value of -1, Theta value of 131, and Vega value of -745.

The final risk profile graph of the position can be seen below:


Stay tuned as I put on my May position in the coming weeks!


Sunday, February 26, 2017

Weekly Update: March and April M3's

This week was a relatively uneventful week for me in relation to my March M3. The only adjustment I had to make was on Tuesday, February 21st because the Vega value of the position was only at -5. I moved half of my butterflies up from 1350 to 1370 as well as added two 1380/1390 verticals to get the position to an adequate Greeks level. The Delta value after the adjustments was -37.6, the Vega was -309.5, and the Theta was 122.2.

The risk profile graph after the adjustment can be seen below:


On Friday of this week, I put on my April M3 since it is now 56 days to expiration. Even though the market was at 1394, I decided to put on 12 butterflies at 1360 because I wasn't getting a high enough negative Delta value that the call I would have had to buy would not have been deep in the money. So, the butterflies bought at this level gave me -95 Delta and allowed me to buy a 1270 call. This also gives me the ability to reduce the butterflies I have in the position instead of buying verticals.

The risk profile graph of the April M3 can be seen below:


Stay tuned as I close my March M3 in the coming weeks!

Sunday, February 19, 2017

March Expiration M3

Hello everyone, below you can see how my March expiration M3 is going.

1/20: To start off the position, I put on 12 butterflies at 1320 with 50 point wide wings and a call at 1180 that gave me a total Delta value of -4. I had to add those two extra butterflies to get greater negative delta and vega values so that I could buy a call deeper in the money with a higher positive Delta value. The market was at 1352 when I started the position.

The risk profile for the beginning position can be seen below:

2/9: I bought a 1360/1370 vertical to reduce the negative Delta of the position. The market was outside of the tent of the butterfly and the Delta value needed to be lower than -50.

2/13: Because the market is just constantly moving up, the Vega became positive and the negative Delta value increased to be more than -50. The verticals themselves would not be able to offset the values, so half of the butterflies were moved up to 1350. A 1370/1380 vertical was also added.

The risk profile from 2/13 can be viewed below:

2/14: With yet another day of the market being up, two 1360/1380 verticals are added to offset the negative Delta value.

2/15: The rest of the butterflies were moved up to 1350 to fix the positive Vega value. Also, two more 1360/1380 verticals are added to gain a satisfactory negative Delta value.

2/17: The extra two butterflies were removed from the position to reduce negative Delta from -70 to -36 and increase the negative Vega. The position is currently down -$589 but there are still 28 days until expiration.

The risk profile from 2/17 can be viewed below:


Stay tuned in the coming weeks to watch as I close my March position and put on an April M3!

Tuesday, January 10, 2017

M3 from January Expiration


Hello, everyone. I know I haven't updated my blog in a long time but I am hoping to get back into the swing of things and update as regularly as I can.

The position seen below is an M3 with a January expiration that I had been trading in the past two months.

11/25 - I bought 15 butterflies at 1330. This is different than the usual 10 butterflies that the M3 position suggests but because 10 butterflies were not giving enough negative Delta, I had to buy 15. The call I bought was at 1260 with a positive 81 Delta value to bring overall delta to a little under -5 like the position is supposed to.

This is the risk profile graph at the start of the position:


12/1 - Today, I am closing position with a $1,440 profit. Because I made so much return in only a week, I decided to take the position out but put on another position on the same day because there is still 50 days until expiration for January. This new position has 14 butterflies at 1290 and a call at 1110.

Here is the risk profile graph of the new position:


12/6 - I bought two 1310/1330 verticals even though the Delta value did not exceed -50. Buying these verticals allowed me to raise the t + 0 line that was sagging between the butterfly and call by reducing the elevated t + 0 line in the tent. Doing this gives me less downside protection higher downside risk but because the market has been continuously bullish, it is safer to have less risk in the front of the position.

12/7 - The Vega value of the position became positive after the market moved higher than the upper wing of the butterfly. In order to correct this, I moved entire position to 1340 and added another butterfly to make 15 total and have a position Delta value of -6.

12/16 - I added two 1330/1340 verticals to flatten out t + 0 line (like before). The position is currently at a profit of $1,158.

This is what the risk profile graph from 12/16 looks like:


12/17 - I added two 1310/1350 verticals because the position's Delta value was at -80. Adding these verticals made it -43 which is within the -50 Delta value limit. This also helped flatten the t + 0 line.

12/20 - I added two 1340/1360 verticals to reduce the negative Delta value of the position and flatten the t + 0 line.

12/23 - I added two 1330/1350 verticals to reduce negative Delta value of the position and flatten the t + 0 line.

12/27 - I took position off with a profit of $2,250 and a total profit from January expiration of $3,690.

Here is the risk profile graph from the end of the trade:


Monday, August 15, 2016

Adjusting the September


 After having the September position on for a few weeks, I have had to make a few adjustments:

August 5th: I had to add two of the 1200/1220 verticals in order to reduce the negative Delta of the position. The market was sitting outside of the tent so I had to adjust the position to have less than -50 Delta.


August 8th: The position had too much negative Delta again so I had to add the 1200/1210 vertical in order to correct it. With the addition of this vertical, the positive Theta and the negative Vega both increased. On this date, the position was up $545.

August 12th: With the negative Delta reaching -55, I had to add the 1200/1220 vertical to the position. Adding this vertical reduced the negative Delta of the position from -54 to -40. The position is currently up $441.

The current risk profile graph looks like this:


Stay tuned over the next few weeks as a keep adjusting my September position!


Wednesday, August 3, 2016

Closing the August Position


  Over the past few days, I have made a series of adjustments to my August position. All of the adjustments I have made were as a result of too much negative Delta. On July 27, July 28, and August 1, I added the vertical 1170/1200 to reduce the negative Delta value of the position (they were at -61, -67, and -60 respectively). The market had been outside of the tent for all of these adjustments. I decided to take the position off yesterday, August 2 with a profit of $1,018. With only 16 days left until expiration, I thought that I should take the profit -which has not been over $1,000 for the position- while I could.

The final risk profile graph of the August 2016 position can be seen below:


The September position is currently at a $479 profit and no adjustments have been needed for this position over the past few days. The September position still has 44 days until expiration.

This is what the September position's current risk profile graph looks like:

Tuesday, July 26, 2016

September Position and Updates to August Position


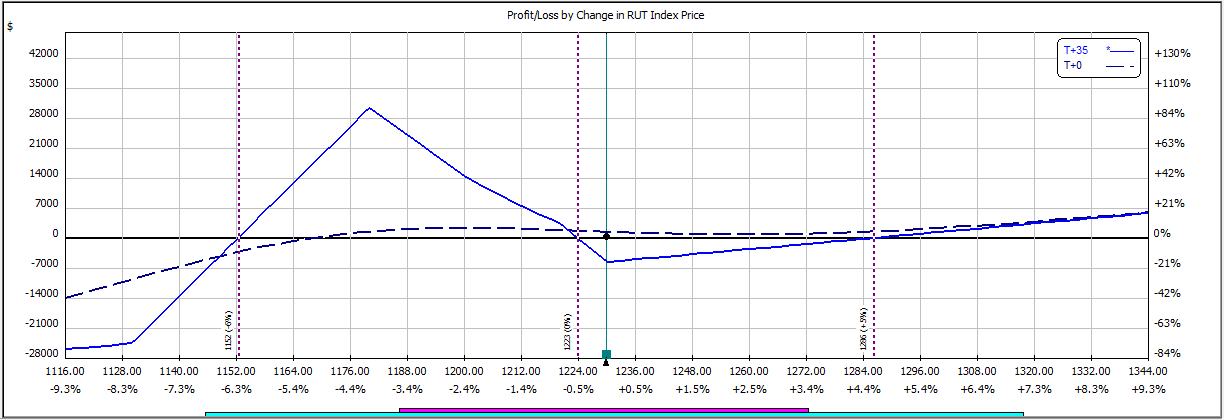
      As I said before, I put on my September position on Friday, July 22 with 56 days until expiration. The butterflies were placed at 1180 with the lower and upper wings at 1130 and 1230 respectively. I then bought a call at 1040 but that was not enough to offset the negative Delta of the butterfly so I added the vertical 1180/1200. Adding the vertical made the total Delta of the position -6 which is close to the ideal -5 starting Delta value for the M3 position. No updates have been necessary to the September position since Friday and the position is currently down $441.

Here is a risk profile graph from Friday:


            Now for the August position. Today, July 26, I moved half of my butterflies up to 1180 because the Vega value of the position was almost positive (only -6) and the market was 10 points above the upper wing. I also had to add the vertical 1180/1200 to reduce the negative Delta of the position from -57 to -45 which also increased the positive Theta and negative Vega. Having all the verticals of the position at 1180/1200 helps reduce the commission cost if this were a live trade. The position is currently down $53 and I see myself taking it down in the coming week since there are only 24 days until expiration.

The current risk profile graph looks like this: